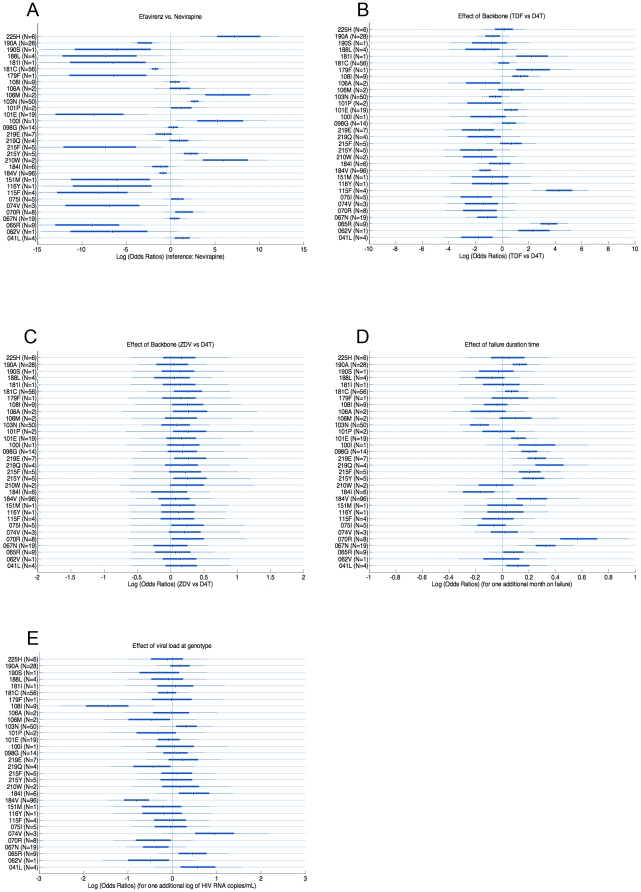
Figure 2. Posterior distributions of the log odds ratios of analyzed parameters for each resistance mutation.
Median posterior distributions, 50%- and 90%-credibility intervals are represented. Distributions are based on 1000 simulations using WinBUGS software. In parentheses are reported the number of patients for which the mutation was observed. A. Distributions of the log odds ratios of efavirenz vs. nevirapine-based HAART. Points to the left of the zero vertical line indicate a greater frequency of the indicated mutation in NVP-based regimens, and points to the right of the zero vertical line in EFV-based regimens. B. Distributions of the log odds ratios of tenofovir (TDF) vs. d4T-based backbone. Points to the left of the zero vertical line indicate a greater frequency of the indicated mutation in d4T-based regimens, and points to the right of the zero vertical line in TDF-based regimens. C. Distributions of the log odds ratios of zidovudine (ZDV) vs. d4T-based backbone. Points to the left of the zero vertical line indicate a greater frequency of the indicated mutation in d4T-based regimens, and points to the right of the zero vertical line in ZDV-based regimens. D. Effect of duration of failure. Distributions of the log odds ratios of one additional month spent on failure. Points to the left of the zero vertical line indicate a greater frequency of the indicated mutation when failure is one-month shorter, and points to the right when failure is one-month longer. E. Effect of viral load at genotype. Distributions of the log odds ratios of each resistance mutation for one additional log of HIV RNA copy/mL. Points to the left of the zero vertical line indicate a greater frequency of the indicated mutation when viral load at genotype is one log lower, and points to the right when viral load is one log higher.

