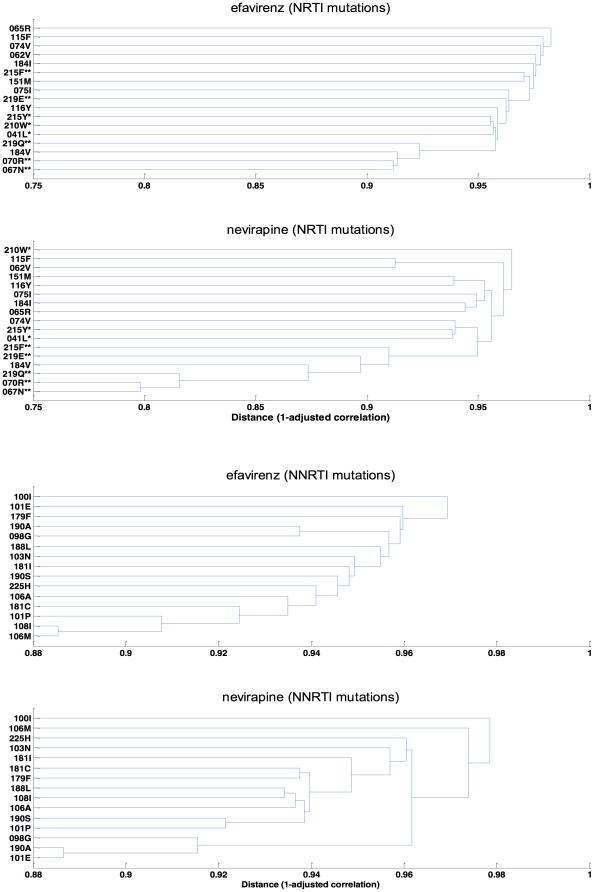
Figure 3. Dendrograms showing correlations between resistance mutations for both nevirapine- and efavirenz-based HAART groups.
The distance between clusters is defined as 1-Pearson correlation adjusted for backbone treatment, and failure duration. Smaller distance indicates greater correlation between mutations (clustering). A. Correlations between NNRTI resistance mutations. B. Correlations between NRTI resistance mutations. Asterisks (*) and (**) indicate respectively TAM-1 and TAM-2 mutations.

