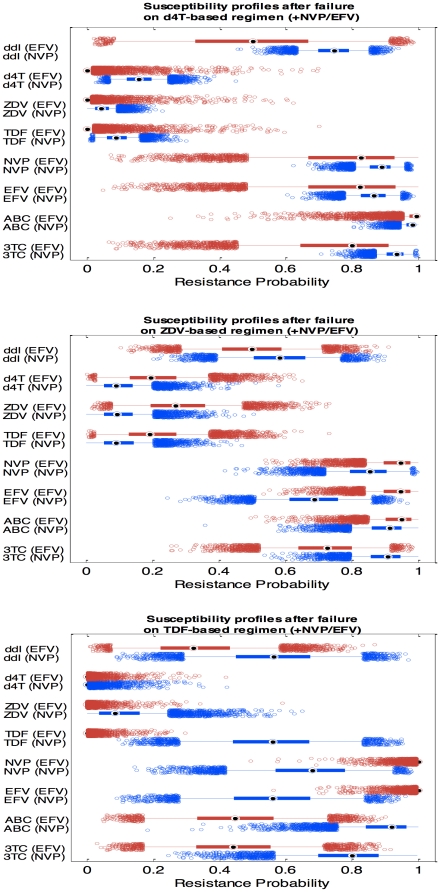
Figure 4. Posterior distribution estimates of the probabilities to belong to resistant subpopulation after virologic failure.
Probabilities of resistance to 3TC, ABC, EFV, NVP, TDF, ZDV, d4T and ddI are shown. Based on a simulated sample (n = 5000), boxplots display median (solid square with circle), 25th and 75th percentiles (wide horizontal line), 90% credibility interval (narrow line), and outliers (small circles) for nevirapine (blue boxplots) vs. efavirenz (red boxplots). A. Failure on treatment with d4T-based backbone, B. Failure on treatment with zidovudine-based backbone. C. Failure on treatment with tenofovir-based backbone.

