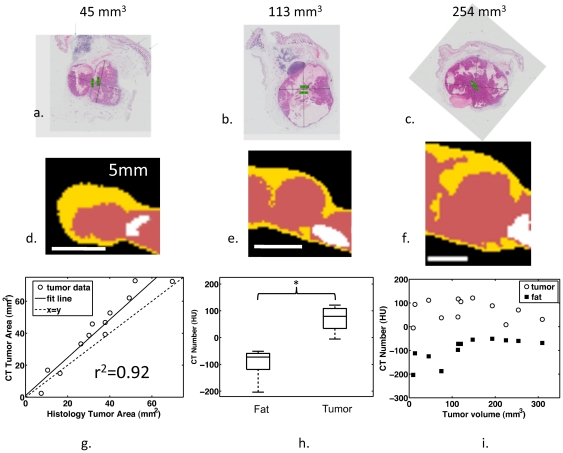
Figure 4. CT segmentation corresponds with histology.
(a–c) Histology and (d–f) corresponding segmented CT slices for tumors of diameters 45 mm3, 113 mm3, and 254 mm3, respectively. (g) The tumor area in histology is correlated with the cross-sectional area of protein-rich tissue detected by CT (r2 = 0.92, slope = 1.2). (h) The average HU of 1 mm2 ROIs in the fat pad is less than within the tumor when averaged across all tumors (p<0.05). (i) The CT number is higher within the tumor compared to the surrounding fat pad for all tumors.

