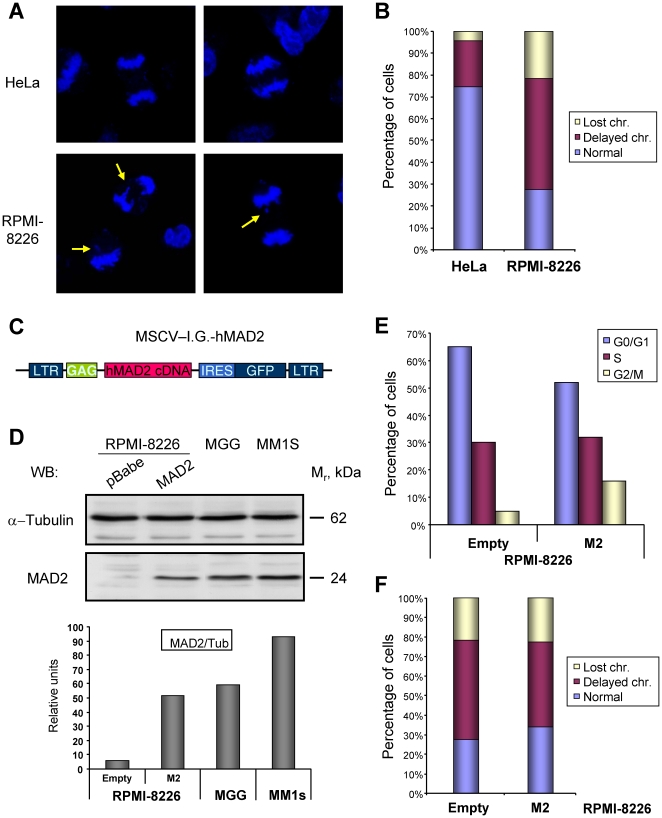
Figure 4. Characterization of the recovery of MAD2 levels on RPMI-8226 cells by retroviral transduction.
A. RPMI-8226 cells exhibit chromosome segregation defects. Hela or RPMI-8226 cells were plated on glass coverslips and 2 days later fixed, counterstained with DAPI and anaphases counted at a fluorescence microscope. Yellow arrows point to chromosomal defects. B. The presence of chromosomes left behind (delayed chromosomes) or lost between the two daughter cells was measured in at least 50 anaphases in the indicated cell lines and represented as the percentage of cells with the different defect. C. Schematic representation of the plasmid used to transduce MM cells with hMAD2. D-F. Recovery of MAD2 levels in the MM cell line RPMI-8226. RPMI-8226 cells were transduced with the vector shown in panel C or empty vector, and 2 days later plated for the subsequent analysis. D. Recovery of MAD2 protein levels. Protein extracts from the indicated cell lines were prepared, 30 µg separated by SDS-PAGE and MAD2 and α-tubulin amount determined by regular WB as indicated (upper panels). Another set was similarly analyzed, but their levels were quantified using appropriate secondary antibodies and the Odyssey software. The relative ratio of both proteins is shown in the lower graph. E. The recovery of MAD2 levels induces a small change in their cell cycle profile, producing the accumulation of more cells in the G2/M transition. F. Besides, a small improvement in chromosomal dynamics in mitosis is detected after MAD2 recovery, measured as described in B.

