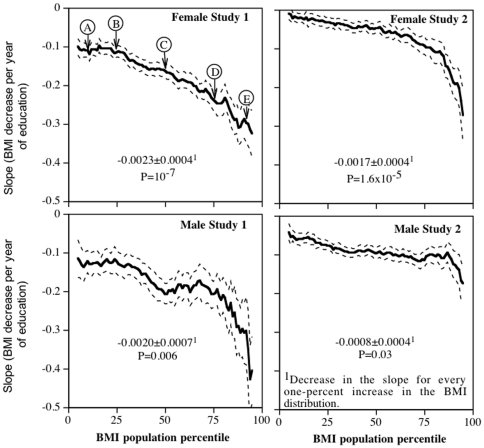
Figure 2. Percentile plot showing the slope for BMI vs. years of education (Y-axis) at each percentile of the BMI distribution (X-axis).
For example, each addition year of education in Study 1 females was associated with a BMI decrease of (slope±SE) −0.117±0.018 kg/m2 at the 10th percentile of their BMI distribution (A), −0.117±0.016 kg/m2 at their 25th percentile (B), −0.165±0.020 kg/m2 at their 50th percentile (C, the median), −0.245±0.029 kg/m2 at their 75th percentile (D), and −0.300±0.046 kg/m2 at their 90th percentile (E, compare with Figure 1). The dashed lines designate one standard error. Data adjusted for age, race, physical activity, and diet. Study 1 included additional adjustment for parental adiposity.

