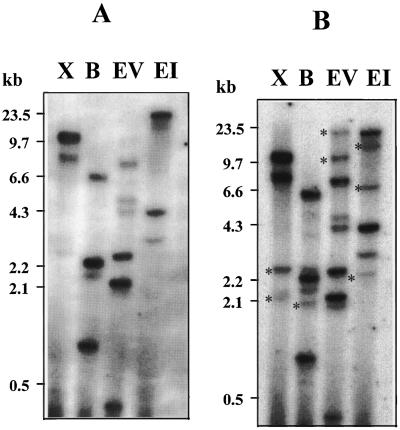
Figure 2.
DNA analysis of arginase genes in the soybean genome. Autoradiogram of blot containing soybean genomic DNA (8 μg) digested with XbaI (lanes X), BamHI (lanes B), EcoRV (lanes EV), and EcoRI (lanes EI). Hybridization was carried out under high- (A) and low- (B) stringency conditions using radiolabeled AG1 cDNA as a probe. Asterisks indicate additional bands not present under high-stringency conditions. Numbers at left indicate marker sizes.

