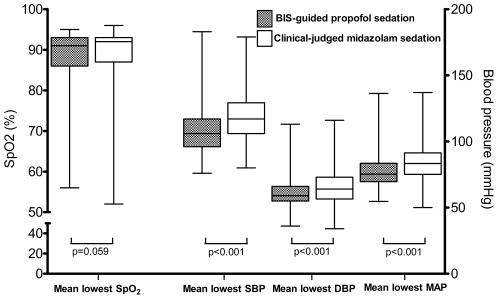
Figure 2. The mean lowest oxygen saturation and blood pressure in both groups.
Boxes represent median and inter-quartile range; whiskers represent range. BIS, bispectral index; SpO2, oxyhemoglobin saturation; MAP, mean arterial blood pressure; SBP, systolic blood pressure; DBP, diastolic blood pressure.

