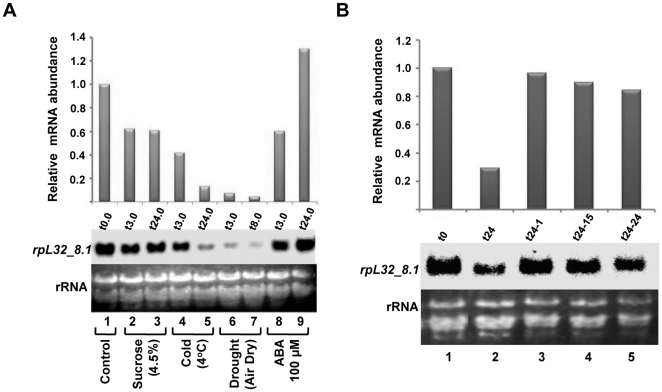
Figure 4. Northern blot analysis of rpL32_8.1 under various treatments and during stress recovery.
(A) Expression analysis under various treatments (sucrose, cold, drought and ABA) as mentioned below each lane. t0.0 to t24.0 indicate the time of treatment (in h). (B) Transcript abundance during stress recovery. t0 (lane 1) and t24 (lane 2) indicate the control (unstressed) and 24 h stressed (200 mM NaCl) tissues. t24-1 (lane 3), t24-15 (lane 4) and t24-24 (lane 5) indicate 1, 15 and 24 h of incubation during recovery from salt stress. All analyses were done as mentioned for Figure 1.

