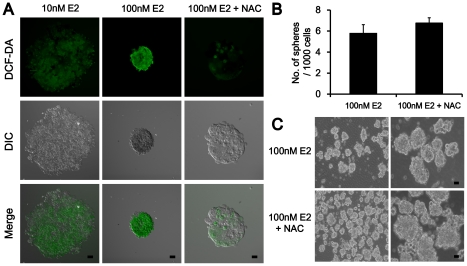
Figure 4. Indirect pathways of E2 on MCF-7 mammosphere proliferation.
(A) ROS detection with DCF-DA. MCF-7 mammospheres treated with 10 nM E2 (left), 100 nM E2 (center), or in concert with 10 µM NAC for 7d (right). The magnification was X 200. Scale bar represents 10 µm in length. (B) The change of mammosphere number by co-treatment with 10 µM NAC. Results were expressed as the number of mammospheres per 1,000 seeded cells at 5d (mean ± SD, n = 3). (C) Secondary MCF-7 mammospheres treated with 100 nM E2 (upper panels) in concert with 10 µM NAC (lower panels). The original magnifications were X 200 except left panel of (C) (X 100). Scale bar represents 10 µm in length.

