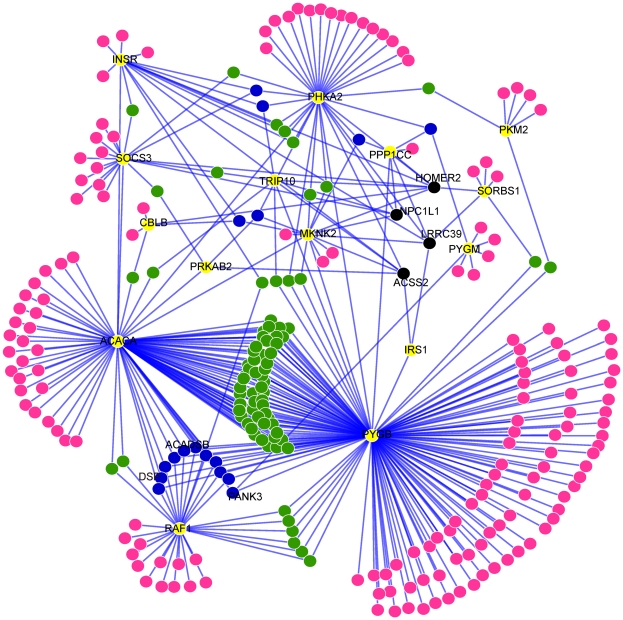
Figure 2. Sub-network for insulin signaling genes and their neighbor genes in the synergy network.
Yellow nodes represent insulin signaling genes, and pink, green, blue and black nodes represent the neighbor genes connecting to one, two, three and more insulin signaling genes, respectively. The fifteen insulin genes, the top three neighbor genes (in Table 2) and the four genes connecting to more than three genes were labeled with gene names for reference.

