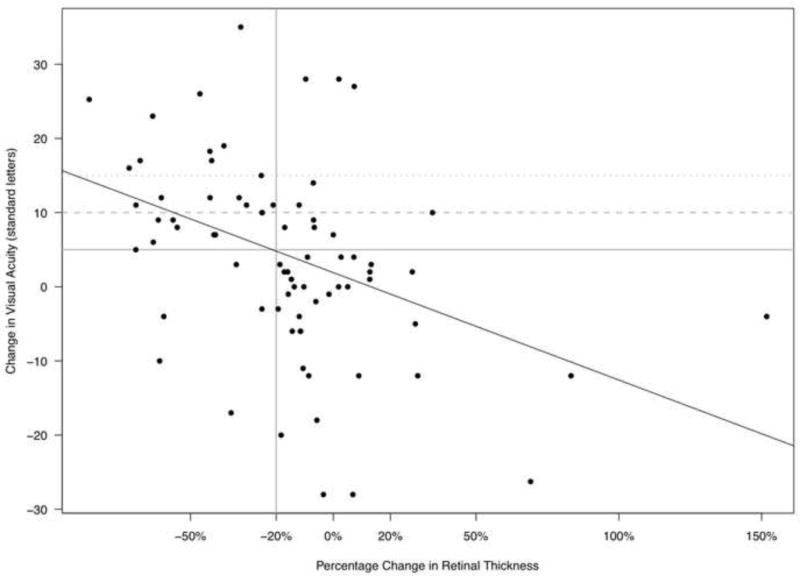
Figure 1.

Plot of the percentage change in retinal thickness at the central subfield measured by optical coherence tomography (OCT) versus the change in visual acuity (VA) from enrollment to six months in eyes with uveitic macular edema.

Plot of the percentage change in retinal thickness at the central subfield measured by optical coherence tomography (OCT) versus the change in visual acuity (VA) from enrollment to six months in eyes with uveitic macular edema.