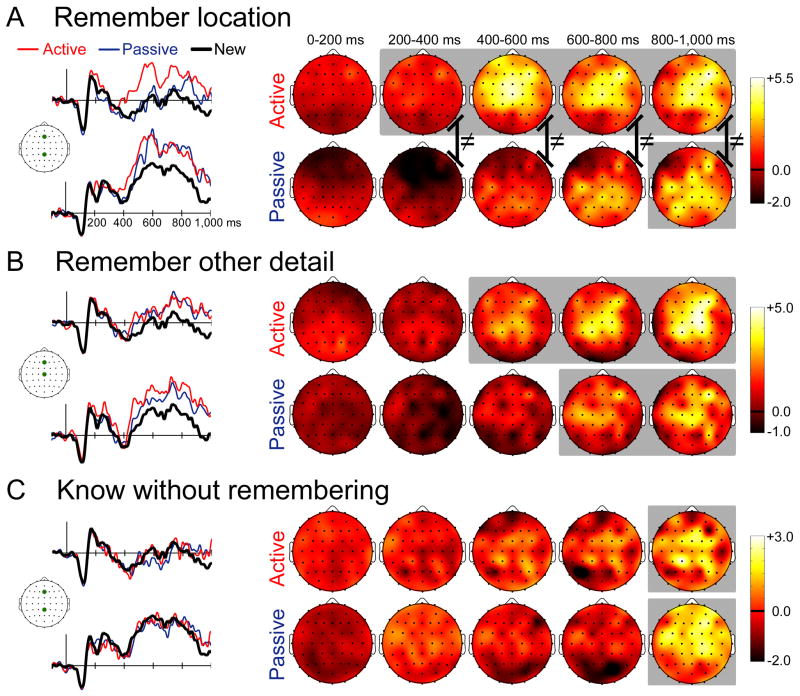
Figure 2. Electrophysiological correlates of memory retrieval.
(A) ERPs for active-studied and passive-studied objects endorsed with remember-location responses and for correctly rejected new objects are shown for two representative electrode locations marked on the cartoon plot of the head. The scalebar indicates 5μV, and positive is plotted up. Topographic plots of the old—new ERP difference are shown in 200 ms intervals starting at stimulus onset. Coloration indicates ERP difference amplitude (μV). The head is shown from a superior view, with anterior facing upward. (B) The same information is provided for active-studied and passive-studied objects endorsed with remember-other responses. (C) The same information is provided for active-studied and passive-studied objects endorsed with know responses. Gray background coloration on topographic plots indicates latency intervals for which any significant old/new differences were identified. Black lines with ≠ symbols indicate significantly different ERP topographies for the active and passive conditions.

