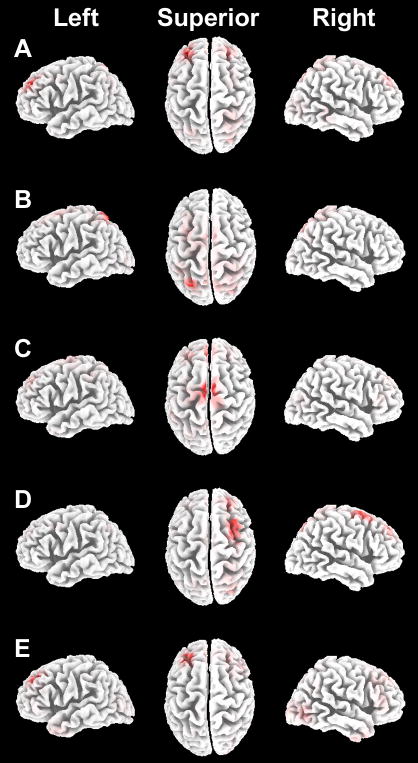
Figure 3. Estimated neural sources of ERP reactivation effects.
Estimated sources are shown for the influences of active versus passive learning on ERP correlates of remember-location responses. Results from each latency interval are shown in A—E, superimposed on a template brain shown laterally for left and right hemispheres and superiorly (with anterior oriented upward). Red coloration indicates the estimated maxima for each latency interval. Maxima for the 0–200 ms interval (A) included left and right Brodmann Area (BA) 8/9 spanning the middle and superior frontal gyri (Talairach coordinates −30, +40, +36 and +25, +38, +43, respectively). For the 200–400 ms interval (B), the maximum was left superior parietal lobule (BA 7, Talairach coordinates −24, −69, +57). For the 400–600 ms interval (C), maxima included left and right medial superior frontal gyrus (BA 6, Talairach coordinates −3, −8, +69 and +6, −11, +69, respectively) as well as more anterior left and right medial frontal gyrus (BA 8, Talairach coordinates −3, +38, +42 and +4, +39, +41, respectively). The maximum for the 600–800 ms interval (D) included right superior frontal gyrus (BA 6/8/9, Talairach coordinates +25, +39, +43). The maximum for the 800–1,000 ms interval (E) included approximately the same region of left superior frontal cortex as shown in A (BA 8/9, Talairach coordinates −27, +31, +43).

