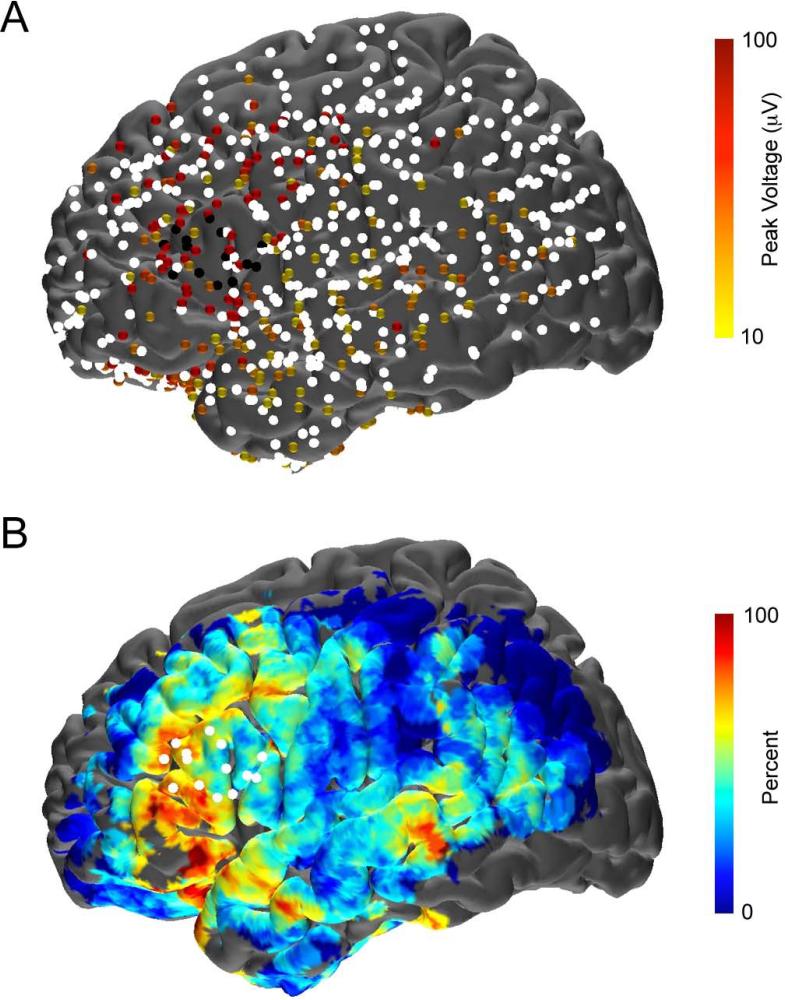
Figure 5.
Grouped representation of N1 responses. (A) Representation of the N1 responses of the CCEP for the group (n = 7) across 837 electrodes following stimulation at 10 distinct electrodes pairs located over BA. N1 responses at each electrode were color coded by amplitude as shown in the legend. Electrodes in white had either no CCEP response or one with an amplitude of < 10 μV. (B) Distribution of N1 responses across all patients. Each point on the cortical surface was colored based on the number of electrodes within 7 mm that had an N1 response. Only locations with >2 electrodes nearby were included to avoid outliers caused by sparse sampling. The white electrodes represent stimulating electrodes.

