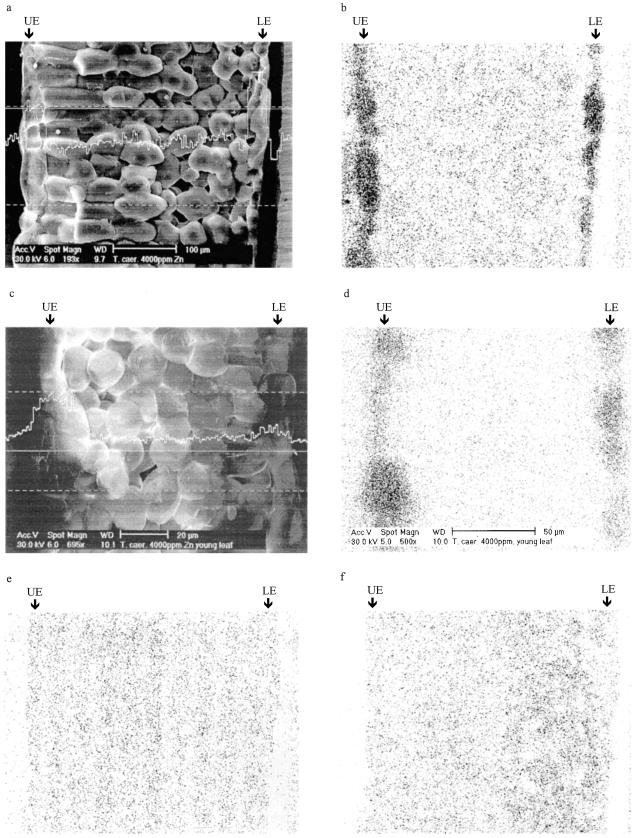
Figure 2.
Distribution of Zn, K, and Ca across different leaf cells of T. caerulescens as revealed by EDXMA of frozen, hydrated tissues. Plants were grown on 4000 μg Zn g−1 for 6 weeks. a, Intensity of the Zn Kα line across a mature leaf section. The measurement took place at the solid straight line. b, Dot map of Zn distribution in a mature leaf section. c, Intensity of the Zn Kα line across a young leaf section. d, Dot map of Zn distribution in a young leaf section. e, Dot map of K distribution in a mature leaf section. f, Dot map of Ca distribution in a mature leaf section. Arrows indicate epidermal cells. UE, Upper epidermis; LE, lower epidermis.

