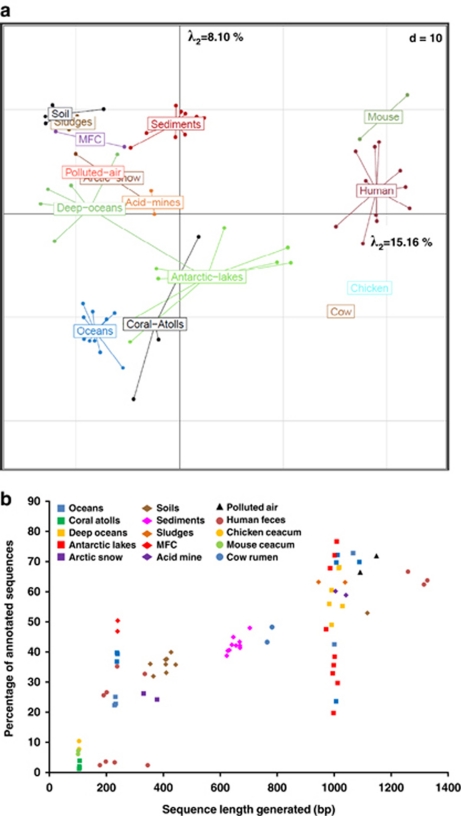
Figure 1.
(a) PCA based on the relative distribution of annotated sequences (E-value<10−5) categorized in 838 different functional subsystems detected in the 77 metagenomes. Distributions were normalized as a function of the number of annotated sequences for each metagenome. The percentages of the illustrated two major axes correspond to the fraction of the total variance that they represent (see insert showing all of the axes and their percentage of the overall variance). (b) Relationship between average sequence length and the percentage of annotated functions (E-value<10−5) for the metagenomes used here. The different average sequence sizes are due in part to variations in sequencing technology. In addition, ocean and Antarctic metagenomes have annotations varying considerably for the same average sequence length. This fluctuation is due in part to the presence of sequences related to eukaryotic and virus sequences for oceans and Antarctic aquatic environments.

