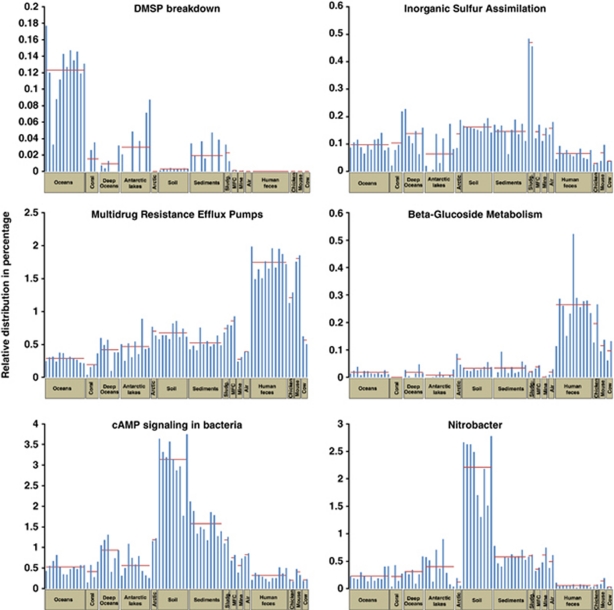
Figure 2.
Comparison of the relative distribution in percentage (based on the annotated sequences (E-value<10−5)) of five functional classes and one genus (SEED annotation) among the 77 metagenomes deposited in MG-RAST. The horizontal line corresponds to the average of the relative distribution for each of the 15 environments.

