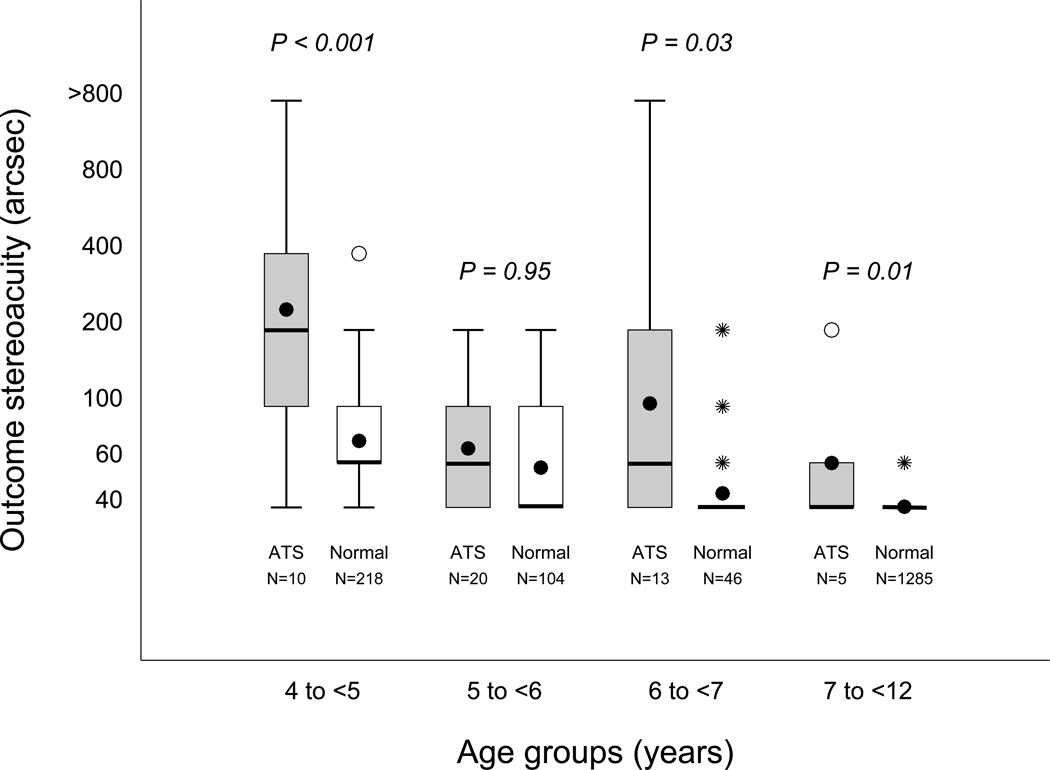
FIG 3.
Age group comparison of stereoacuity among subjects with amblyopic eye visual acuity of 20/25 or better and within one line of the fellow eye visual acuity compared to normal children. For each age group, the box on the left (gray) is the distribution of stereoacuity scores for the Amblyopia Treatment Study subjects and that on the right (white) represents the normal children. The top and bottom of each box represent the 25th and 75th percentiles of the data, the group medians are represented by a bolded line, and the group means are represented by a dot. For some of the box plots, the median also corresponds to the 25th and/or 75th percentile. The bars extending above and below each box represent 1.5 times the interquartile range (difference between the 25th and 75th percentiles). The open circles represent near statistical outliers, and the asterisks indicate far outliers. P values are from the age-matched comparison of stereoacuity among children with amblyopic eye visual acuity of 20/25 or better and within one line of the fellow eye visual acuity at outcome compared to that of normal children based on the Wilcoxon exact rank-sum test.

