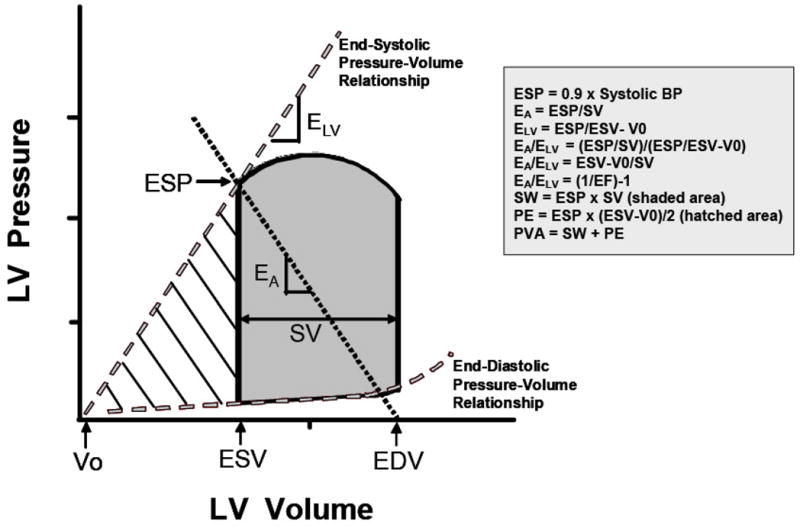
FIGURE 9.

Ventricular pressure-volume diagram from which effective arterial elastance (EA) and left ventricular (LV) end-systolic elastance (ELV) are derived. EA represents the negative slope of the line joining the end-diastolic volume (EDV) and the end-systolic pressure (ESP) points. ELV represents the slope of the end-systolic pressure-volume relationship passing through the volume intercept (V0). The shaded area represents the cardiac stroke work (SW), and the hatched area represents the potential energy (PE). LV ESP is the LV pressure at the end of systole. EDV is the LV volume at the end of diastole. End-systolic volume (ESV) is the LV volume at the end of systole. Stroke volume (SV) is the volume of blood ejected by the LV with each beat and is obtained from subtracting ESV from EDV. BP, blood pressure; EF, ejection fraction; PVA, pressure-volume area. (With permission from Chantler, Lakatta, Najjar. Arterial-ventricular coupling: mechanistic insights into cardiovascular performance at rest and during exercise, J Appl Physiol 105:1342–1351, 2008, and based on Sunagawa et al. 1983. Left ventricular interaction with arterial load studied in isolated canine ventricle. The Am J of Phys, 245 (5 Pt 1), H773-80).
