Figure 2.
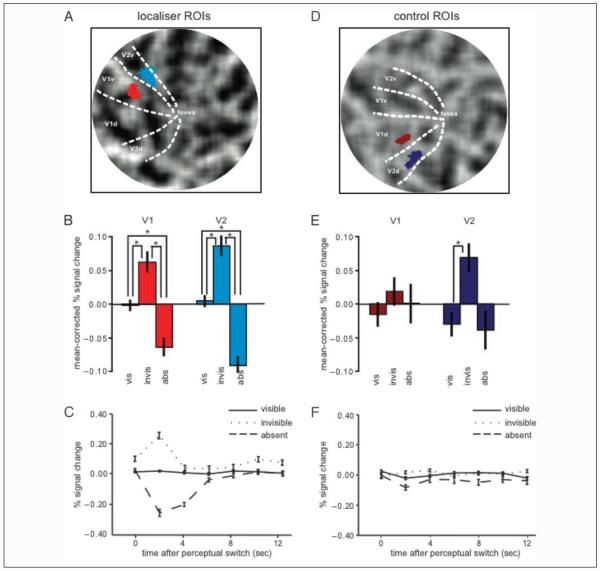
BOLD signal in localizer and control ROIs. The retinotopic regions in visual cortex (localizer ROIs) representing the spatial location of the target for a representative participant are shown on a flattened representation of the right (contralateral) visual cortex (A; V1 is bright red, V2 is bright blue). Mean percent BOLD signal change (mean corrected and compared with resting baseline) in these regions for the three conditions [vis (target visible)–invis (target invisible)–abs (target absent)] are plotted in B; bright red bars represent the V1 localizer, and bright blue bars represent the V2 localizer. Error bars represent the group SEM. Raw data are shown in Supplementary Figure 2. Time courses of these three conditions are shown in C for the localizer region in V1. Time zero signals the time of the perceptual switch; time courses for the visible, invisible, and absent condition are shown in straight, dotted, and dashed lines, respectively. Retinotopic regions of the same size but representing the right lower visual quadrant (control ROIs) are shown in D, on a flattened representation of the left visual cortex for the same representative participant (V1 is dark red, V2 is dark blue). Mean percent BOLD signal change (mean corrected and compared with resting baseline) for the three conditions (target visible–invisible–absent) is plotted in E; dark red bars represent the V1 control ROI, and dark blue bars represent the V2 control ROI. Again, raw data are shown in Supplementary Figure 2. Time courses of the three conditions for the control ROI in V1 are shown in F; conventions are the same as in C.

