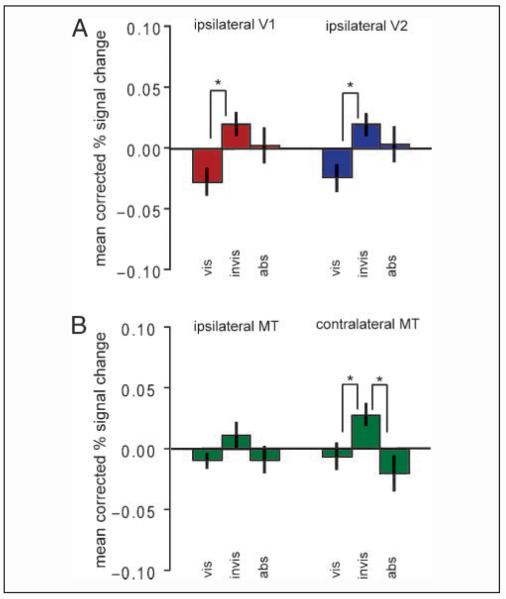
Figure 3.
BOLD signal in other control regions. Mean percent BOLD signal change (mean corrected and compared with resting baseline) is shown for the three conditions [vis (target visible)–invis (target invisible)–abs (target absent)] for the whole of ipsilateral (left) V1 and V2 (A) and for ipsilateral (left) and contralateral (right) V5/MT (B). Error bars represent the group SEM. Raw data are shown in Supplementary Figure 2.

