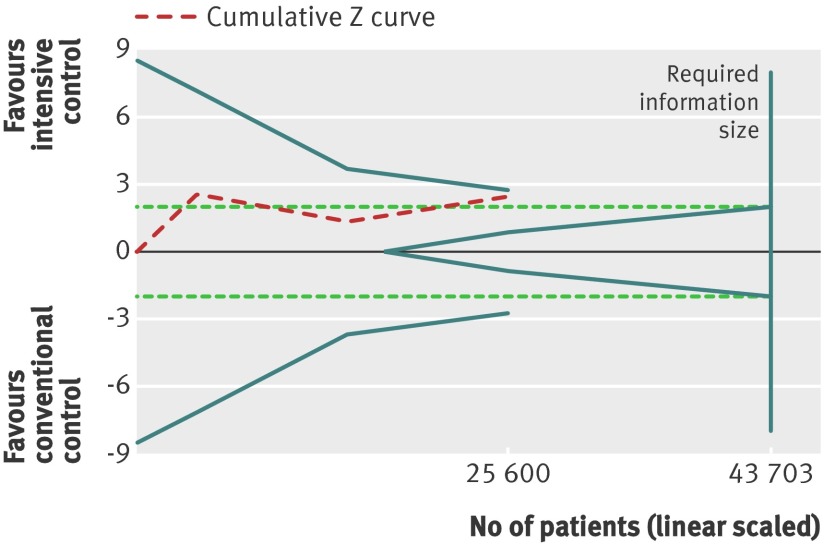
Fig 9 Trial sequential analysis for composite microvascular outcome. Heterogeneity corrected required information size of 43 703 participants calculated on basis of proportion of composite microvascular outcome of 11.1% in conventional glucose control group, relative risk reduction of 10%, α=5%, β=20%, and I2=45%. Dashed red cumulative Z curve does not cross solid blue trial sequential monitoring boundaries for benefit or harm. Horizontal dotted green lines illustrate the traditional level of statistical significance (P=0.05)

An official website of the United States government
Here's how you know
Official websites use .gov
A
.gov website belongs to an official
government organization in the United States.
Secure .gov websites use HTTPS
A lock (
) or https:// means you've safely
connected to the .gov website. Share sensitive
information only on official, secure websites.
