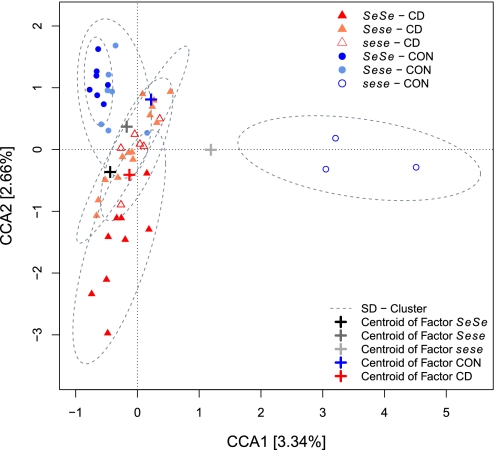
Fig. 2.
Ordination of individuals using CCA of disease status and its interaction with genotype, conditioned by the factors age and sex. The ordination includes only nonredundant factors that were validated by variance inflation scores ranging between 1.1 and 3.6. Only axes that significantly contribute to the explained variance (expl. var.) are displayed (CCA1: expl. var. = 3.34%, P = 0.007; CCA2: expl. var. = 2.66%, P = 0.03; CCA3: expl. var. = 2.44%, P = 0.171; CCA4: expl. var. = 2.19%, P = 0.476; CCA5: expl. var. = 1.76%, P = 0.944).

