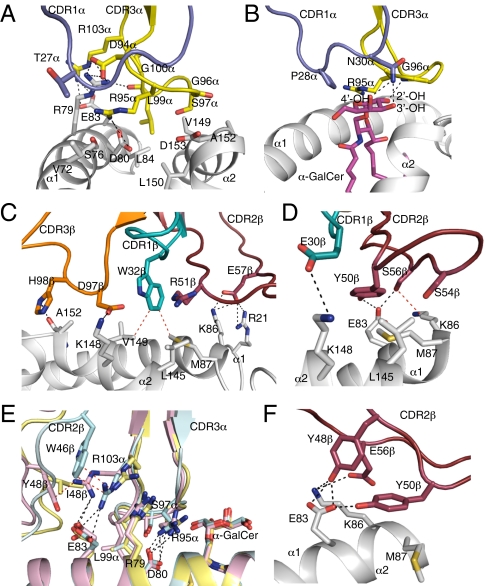
Fig. 3.
Vα14Vβ2 NKT TCR-mediated interactions with mouse CD1d and α-GalCer. (A) Vα14Vβ2 NKT TCR CDR1α- and CDR3α-mediated contacts with CD1d and (B) α-GalCer. Gray, CD1d; purple, CDR1α; yellow, CDR3α. (C) Vα14Vβ2 NKT TCR CDR1β-, CDR2β-, and CDR3β-mediated contacts with CD1d. Gray, CD1d; teal, CDR1β; ruby, CDR2β; orange, CDR3β. (D) Vα14Vβ7 NKT TCR CDR1β- and CDR2β-mediated contacts with CD1d. CD1d, CDR1β, and CDR2β color coding as in C. (E) Superposition of Vβ2, Vβ8.2, and Vβ7 NKT TCR-CD1d-α-GalCer complexes. Blue, Vβ2 complex; pink, Vβ8.2 complex; yellow, Vβ7 complex. (F) Vα14Vβ8.2 NKT TCR CDR2β-mediated interaction with CD1d. CD1d and CDR2β color coding as in C. H-bond or salt bridge interactions are shown in black dashed lines, and some vdw interactions are shown in red dashed lines.

