Fig. 4.
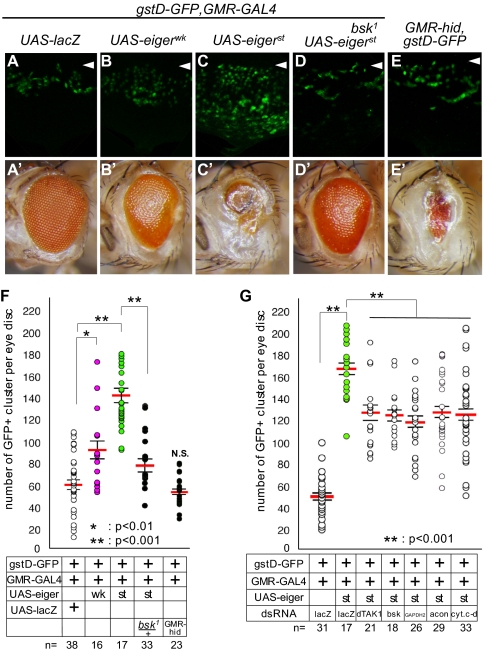
Activation of Eiger signaling induces ROS production. (A–E) Eye imaginal discs of wandering third instar larvae. Anterior is to the top. Arrowheads indicate the morphogenetic furrow. (A′ –E′) Adult eye images of A–E. Anterior is to the left. (F) The number of proommatidial clusters that expressed GFP within the single eye discs shown in A–E was counted and analyzed statistically. Asterisks indicate statistical significance, which was determined by Student's t test. *P < 0.01; **P < 0.001. wk and st mean weak and strong alleles of UAS-eiger, respectively. (G) RNAi-based knockdown of JNK pathway components or mitochondria-related genes attenuated the production of ROS induced by the overexpression of Eiger. Each bar in the graphs of F and G represents the mean ± SEM. The number of independent data points in F and G is indicated as n.

