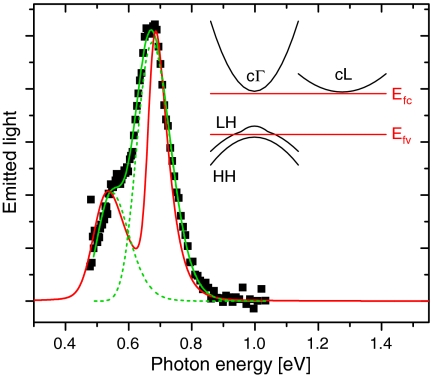
Fig. 5.
Numerical modeling of Ge NM luminescence at high strain. Symbols, normalized PL spectrum of the NM of Fig. 3 at a strain of 1.78%. Green lines, Gaussian fits showing the cΓ-HH and cΓ-LH contributions (dashed) and their sum (solid). Red line, calculated spontaneous-emission spectrum. The vertical axis is in arbitrary units. (Inset) Schematic band diagram of Ge at a strain of 1.78%, and estimated positions of the quasi-Fermi levels relative to the band edges in the presence of the PL pump pulses.

