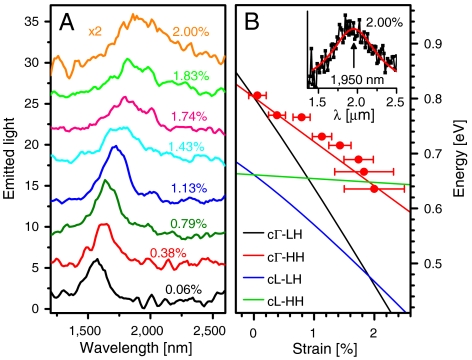
Fig. 6.
Strain-dependent luminescence properties of a 24-nm-thick Ge NM. (A) PL spectra of a 24-nm-thick Ge NM at different levels of biaxial tensile strain (shifted vertically relative to one another for the sake of illustration clarity). The vertical axis is in arbitrary units. A small degree of smoothing (three-adjacent-points averaging) has been applied to these data. (B) Symbols, peak emission energies obtained from the PL spectra of A, plotted as a function of strain. Lines, calculated bandgap energies between the Γ or L conduction-band minima and the HH or LH valence-band maxima. (Inset) Normalized PL spectrum of the NM of A, measured at a tensile strain of 2.00% (symbols) and corresponding Gaussian fit (solid line).

