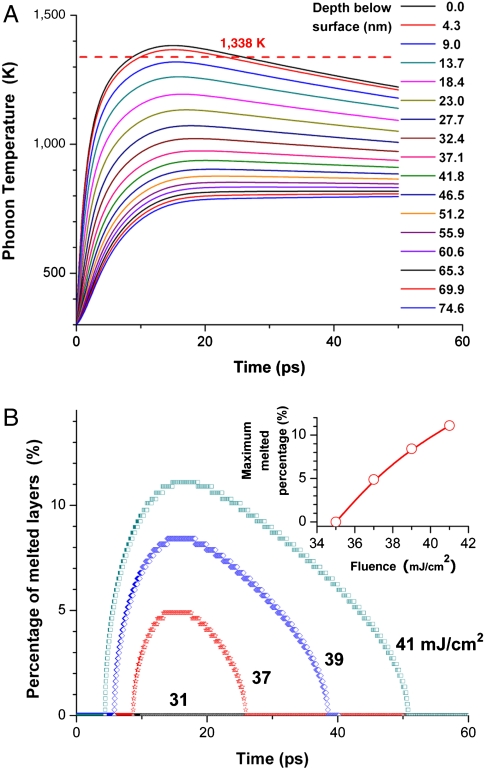
Fig. 5.
(A) Time dependence of the phonon temperature at various depths below the irradiated surface. The horizontal dashed line represents the melting point of 1,338 K. (B) Time dependence for the population growth of the melted layers is in percent of all crystal layers. (Inset) The maximum percent of the melted layers. At the laser fluence of 37 mJ/cm2, as used in our experiments, about 5% of the surface layers were melted.

