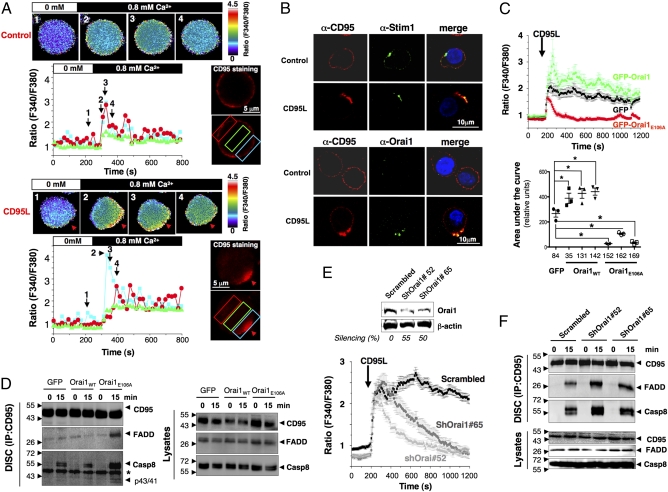
Fig. 2.
STIM1/Orai1 distribution into the CD95-Cap triggers localized Ca2+ entry, impeding DISC formation. (A) Ca2+ influx colocalizes with CD95 at the DISC. In activated PBLs, CD95 was stained and untreated (Upper) or treated (Lower) with 100 ng/mL CD95L at 37 °C. CD95 labeling was analyzed using a conventional videomicroscopy setup (CD95 staining), and images of the fura-2PE3-AM fluorescence (F340nm/F380nm) were obtained every 5 s and translated into false colors according to the color scale shown on the right of the recorded cells. Cells were bathed in a Ca2+-free extracellular medium (white bar), and 0.8 mM Ca2+-containing medium was perfused in the bath (black bar) to visualize Ca2+ influx in CD95L-stimulated and unstimulated cells. For each condition, intracellular Ca2+ concentration was recorded at different time points. Black arrowheads and numbers in the histogram correspond to the above-annotated images. Red arrows indicate CD95-Cap. In the histograms, colored curves indicate the ratios (F340nm/F380nm) recorded in different areas of the activated PBLs depicted by colored rectangles. (B) Immunostaining showing colocalization of STIM1 and Orai1 with CD95. Activated PBLs were incubated in the presence or absence of CD95L (100 ng/mL) for 15 min. Cells were fixed and stained for CD95, STIM1, or Orai1. Nuclei are depicted in blue. Images were acquired with a confocal microscope using an Apoplan 63× objective. (C) Inhibition of Ca2+ entry by GFP-Orai1E106A. (Upper) [Ca2+]i was assessed in Jurkat clonal cell lines expressing GFP alone (clone 84), GFP-Orai1 (clone 142), or GFP-Orai1E106A (clone 152) stimulated with 100 ng/mL of CD95L. The black arrow indicates addition of CD95L. Shown are the mean ± SD of more than 50 individual responses in Jurkat cells expressing GFP (black trace), GFP-Orai1E106A (red trace), or GFP-Orai1 (green trace). (Lower) Statistical analysis of the area under the curve for all isolated Jurkat clones in three independent experiments. *P ≤ 0.05. (D) Immunoblot of DISC components in Jurkat T cells expressing GFP alone, GFP-Orai1, or GFP-Orai1E106A. Cells were incubated for 15 min with 1 μg/mL of APO1-3, and DISC components (Left) and total lysates (Right) were analyzed. These immunoblots are representative of three independent experiments. (E) ShRNA knockdown of Orai1 inhibits Ca2+ influx. (Upper) Jurkat cells infected with scrambled or two different Orai1-targeting shRNA lentiviruses were lysed, and the expression level of Orai1 was evaluated by immunoblot analysis. β-actin was used as a loading control. (Lower) [Ca2+]i was determined as detailed in A. The mean ± SD of more than 30 individual responses to 100 ng/mL CD95L is shown. (F) Immunoblot of DISC components in cells described in E, stimulated for the indicated times with 1 μg/mL of APO1-3, and lysed to determine DISC formation. The data are representative of three independent experiments.

