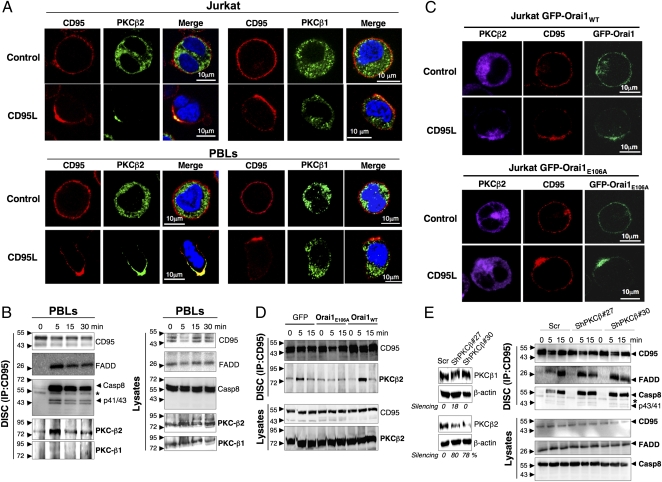
Fig. 3.
Localized CD95-mediated Ca2+ entry redistributes PKCβ2 to the CD95-Cap. (A) Immunostaining of CD95, PKCβ1 (Right), or PKCβ2 (Left) in Jurkat T cells and activated PBLs that were untreated (control) or treated with 100 ng/mL CD95L for 15 min, fixed, and stained. Nuclei were stained using Hoechst 33248 (blue). Images were acquired with a confocal microscope with an Apoplan 63× objective. (B) Immunoblots of DISC components in activated PBLs incubated for the indicated times with 1 μg/mL of APO1-3 (Left). Total lysates were added as a control (Right). (C) Localization of CD95 and PKCβ2 in GFP-Orai1– and GFP-Orai1E106A–expressing Jurkat cells treated (CD95L) or untreated (control) for 15 min with 100 ng/mL of CD95L. Cells were fixed, permeabilized, and stained for CD95 and PKCβ2. Images were acquired as above. (D) Distribution of PKCβ2 in the DISC formed in GFP, GFP-Orai1E106A, and GFP-Orai1 Jurkat cells incubated for the indicated times with 1 μg/mL of APO1-3. (E) Immunoblot showing DISC components in cells after knockdown of PKC-β2. (Left) H9 T cells infected with lentivirus encoding scrambled ShRNA or two different PKC-β2–targeting ShRNAs were lysed, and the expression levels of PKCβ2 and β1 were assessed by immunoblot analysis. β-actin was added as a loading control. (Right) The aforementioned H9 T cells were incubated for the indicated times with 1 μg/mL of APO1-3, after which CD95 was immunoprecipitated and the DISC analyzed. Data are representative of three independent experiments.

