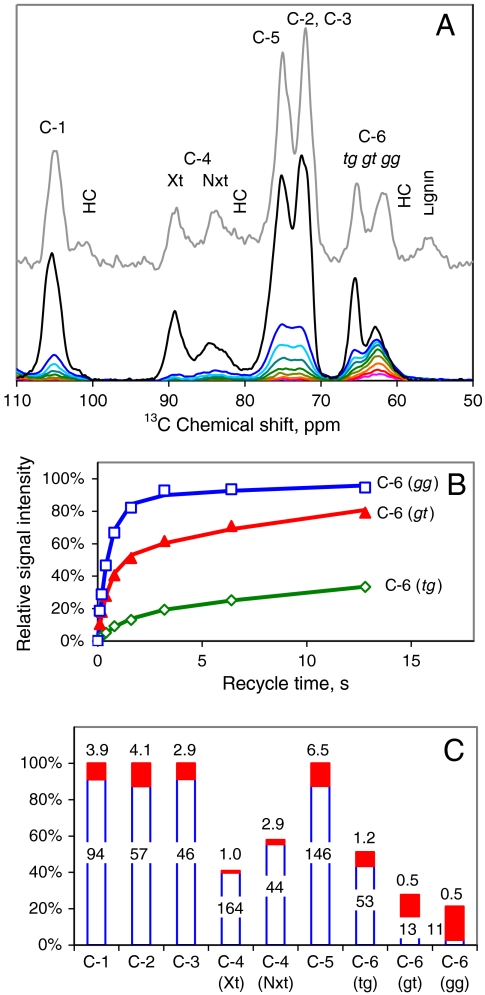
Fig. 3.
13C spin-lattice NMR relaxation experiments on spruce cellulose. (A). All cellulose chains are represented in the CP-MAS spectra of spruce wood (top spectrum) and cellulose isolated from it (second top). Shortening the recycle times in the MOST experiment restricted the spectral contribution progressively to the most mobile carbon atoms, particularly C-6. The MOST recycle times were (third to bottom) 12.8, 6.4, 3.2, 1.6, 0.8, 0.4, 0.2, and 0.1 s. The scaling of the CP-MAS spectra relative to the MOST spectra is arbitrary. (B). Relative intensity of the deconvoluted tg, gt, and gg components of the C-6 signal from isolated spruce cellulose as a function of recycle time in the MOST experiment, with dual-exponential fitted curves. (C). Dual-exponential fitted parameters. The histogram shows the proportions of the long-T1 and short-T1 components of each signal and the figures are the corresponding T1 values in s.

