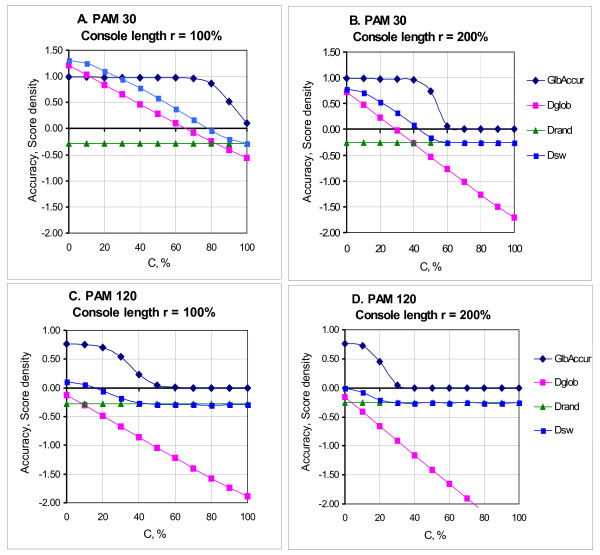
Figure 4.
"Slope zone" of the Smith-Waterman global alignment and density of reference and random alignments. A, B - evolutional distance of 30PAM; C, D - evolutional distance of 120PAM. A, C - console length r = 100%; B, D - console length r = 200%. Mean densities of reference (Dglob) and random (Drand) alignments and mean accuracy of Smith-Waterman global alignments (Glb.Accur) versus the asymmetry value of consoles c at evolutional distances 30 and 120PAM and consoles of 100% and 200% length of the core length of the sequences. The intersection of straight lines - plots of the Dglob and Drand values corresponds to the beginning of the "slope zone" of the accuracy plot (see also Fig. 3). Densities of Smith-Waterman global alignments are given for comparison. Here the intersection of plots for Dglob and Drand values is typically close to the point where the plot for Dsw passes the zero value. At rather high c values the density of algorithmic global alignments (Dsw) is close to the density of random alignments (Drand).

