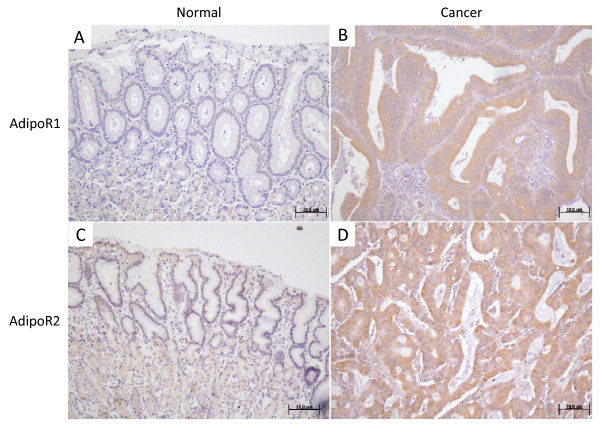
Figure 4.
Representative photomicrographs. Representative photomicrographs of immunohistochemical staining of AdipoR1 (A, normal mucosa; B, cancer tissue) and AdipoR2 (C, normal mucosa; D, cancer tissue). AdipoR1 and AdipoR2 were expressed in normal gastric mucosa in the cytoplasm as well as in the cell membrane. In gastric cancer tissues, higher intensity of immunostaining compared to normal mucosa was considered positive. Original magnification, ×100.

