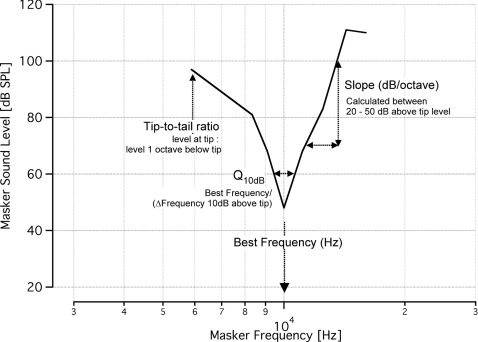
Figure 2.
Representative tone-on-tone MTC with calculations for data analysis. This tone-on-tone MTC shows the best frequency (tip of the tuning curve) and the sharpness of tuning, Q10dB, which was determined by the ratio of BF to the MTC width at 10 dB sound level above BF level. For the tuning curve shown, BF = 10 kHz and the level at BF is 50 dB. At a sound level of 60 dB, or 10 dB above the BF level, the width of the curve extends from 9.4 to 10.4 kHz, giving Q10dB = 10/(10.4 to 9.4) = 10. The slope was measured as the rise/run between 20 and 50 dB above the BF level. When the high frequency side of a curve did not extend 50 dB above the BF level, we calculated the slope to the highest masker level. At 20 dB above the BF level, or 70 dB, the frequency is 11.2 kHz, and at 50 dB above the BF level, the frequency is 13.4 kHz. Therefore, the slope = (100 to 70 dB)/log2(13.4kHz/11.2kHz) = 115.9 dB/octave. The tip-to-tail ratio was measured as the ratio between the masker level at the BF to the masker level one octave below the BF. For this tuning curve, one octave below the BF occurs at 5 kHz, however, the data do not extend to quite this low of a frequency. When the low frequency tail did not extend one full octave below the best frequency, as is the case with this curve, the masker level at the lowest frequency of the tail was used. At this frequency, we measured a sound level of 97 dB, giving a tip-to-tail ratio = 50/97 = 0.51.

