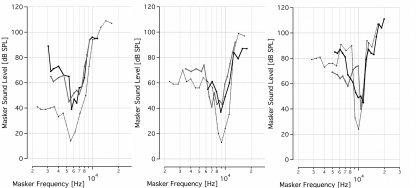
Figure 3.
Tone-on-light MTCs demonstrate spatially selective infrared neural stimulation. Several examples of tone-on-light MTCs, shown in solid lines, are compared with the tone-on-tone MTCs, shown in dotted lines. The data are presented on three separate graphs, grouped according to BF, for clarity of presentation. Each tone-on-light MTC shows the raw data measured from one trial in one animal with a fixed optical fiber position and fixed laser energy/pulse. Each tone-on-tone MTC shows the raw data measured from one masking trial in one animal at one fixed probe frequency and level. Optical fiber locations were varied between trials, therefore leading to MTCs with different BFs. Both optical and acoustic probe levels were selected that a 40 to 50 μV CAP resulted when the probe was presented alone.

