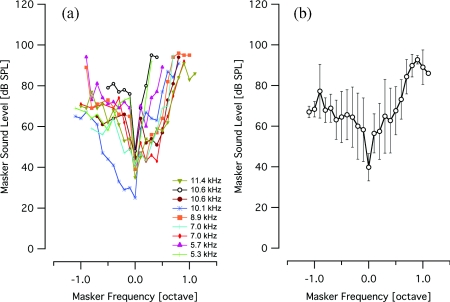
Figure 4.
Normalized tone-on-light MTCs. (a) The graph shows nine tone-on-light MTCs that have been normalized on the frequency axis, represented in octaves. The zero point corresponds to the BF of the MTC. All tone-on-light MTCs exhibit a tuned response. Most MTCs extend over a ∼1.5 octave range. The legend shows the BF of the MTC. (b) This graph presents the averaged data from (a) with error bars representing the standard deviation. Some data points reflect the average and standard deviation of fewer than nine measurements due to the variation in bandwidth of the individual MTCs. Note that the octave is a log2 representation of frequency, in contrast to the log10 abscissa shown in Fig. 3.

