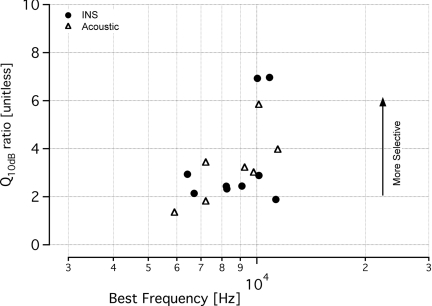
Figure 5.
Selectivity and quantification of tone-on-tone and tone-on-light MTCs. Q10dB values indicate the sharpness of tuning for tone-on-tone and tone-on-light MTCs. The tone-on-light MTCs have similar Q10dB values to the tone-on-tone MTCs, with a larger Q10dB ratio signifying a more selective stimulation. Data from tone-on-light MTCs are represented by filled circles and tone-on-tone MTCs are represented in open triangles. Tone-on-light MTCs had Q10dB ratios that ranged from 1.9 to 7, with an average value of 3.4 ± 2.0 (mean ± s.d.; n = 9) and a median value of 2.4. These values are similar to the tone-on-tone MTCs, which ranged from 1.8 to 5.8 (mean: 3.2 ± 1.5; median 3.2; n = 8). A Q10dB ratio could not be calculated for the acoustic CAP tuning curve with a BF at 5.3 kHz because the low frequency side of the curve did not increase 10 dB.

