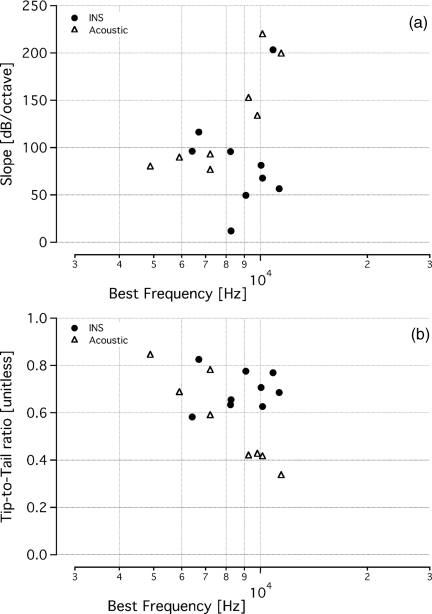
Figure 6.
MTC slope and tip-to-tail calculations. Calculations of the slope of the high frequency side of the MTCs and the tip-to-tail ratio show tone-on-light MTCs exhibit similar values to tone-on-tone MTCs, though they vary over a larger range. Data from tone-on-light MTCs are represented by filled circles and tone-on-tone MTCs are represented in open triangles. (a) Slopes ranged between 11 and 203 dB/octave (mean: 87 ± 54 dB/octave; median: 81 dB/octave) for tone-on-light data. Note, all but one data set had a slope greater than 50 dB/octave. Slopes measured for acoustic MTCs ranged from 75 to 219 dB/octave (mean: 130 ± 56 dB/octave; median: 112 dB/octave). (b) Tip-to-tail ratios of tone-on-light and tone-on-tone tuning curves have similar values and ranges. Ratios for tone-on-light MTCs were 0.58 to 0.82 (mean: 0.7 ± 0.08; median: 0.69) and ratios for tone-on-tone MTCs were 0.33 to 0.84 (mean: 0.56 ± 0.19; median: 0.50).

