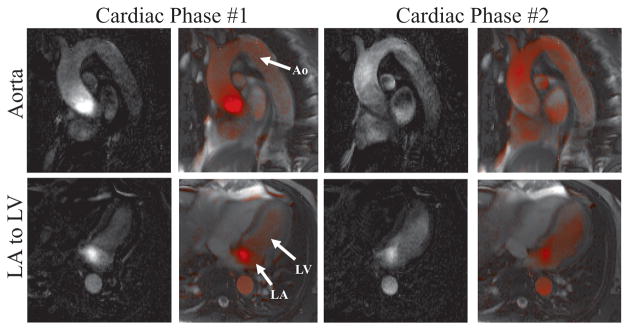
Figure 10.
VDA visualization in a normal human volunteer using the “interpolation-and-subtraction” visualization mode. In experiment #1 (upper row) flow is visualized in the aorta and in experiment #2 (lower row) flow is visualized from the LA to the LV. Color-blended and the corresponding raw difference images are shown for two cardiac phases from each experiment.

