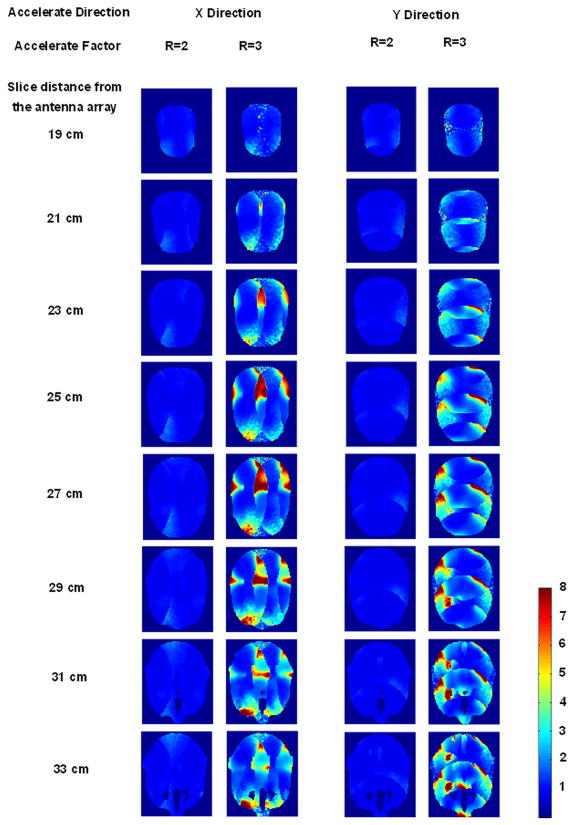
Figure 8.
Simulation results: g-factor maps for 1D SENSE at reduction factor R of 2 and 3 for the original array configuration in loaded case, regarding the average g-factors shown in Table 2. Eight targeted slices were at the distance of 19 cm, 21 cm, 23 cm, 25 cm, 27 cm, 29 cm, 31 cm and 33 cm from the patch array. Left two columns: g-maps for 1-D SENSE at acceleration direction of x; Right two columns: g-maps for 1-D SENSE at acceleration direction of y.

