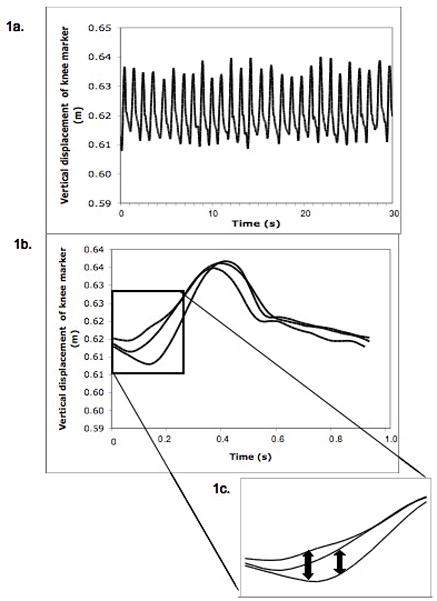
Figure 1.

Lyapunov Exponent (LyE) calculation visual analogy, using data from consecutive stride cycles of the knee marker of an adult participant with Down syndrome (DS). Knee marker vertical position time series (1a). Three strides extracted from the time series and overlaid (1b). Magnified version of an isolated segment of the state space illustrating divergence between neighboring trajectories (1c).
