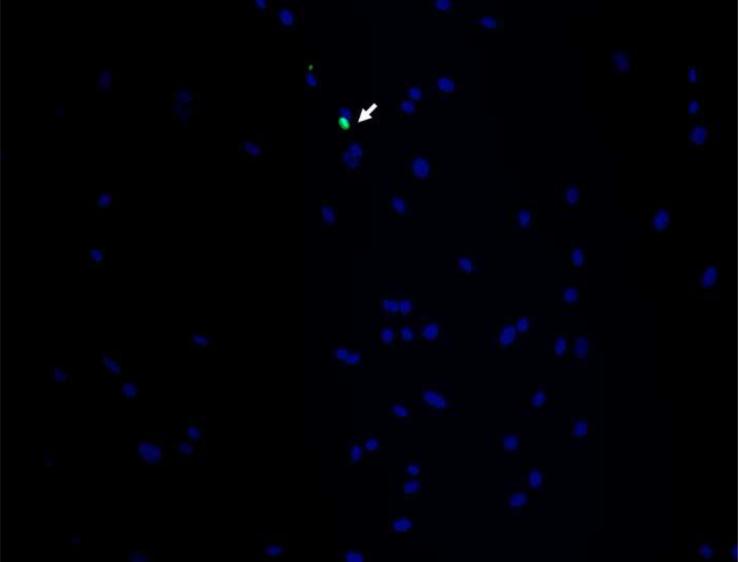
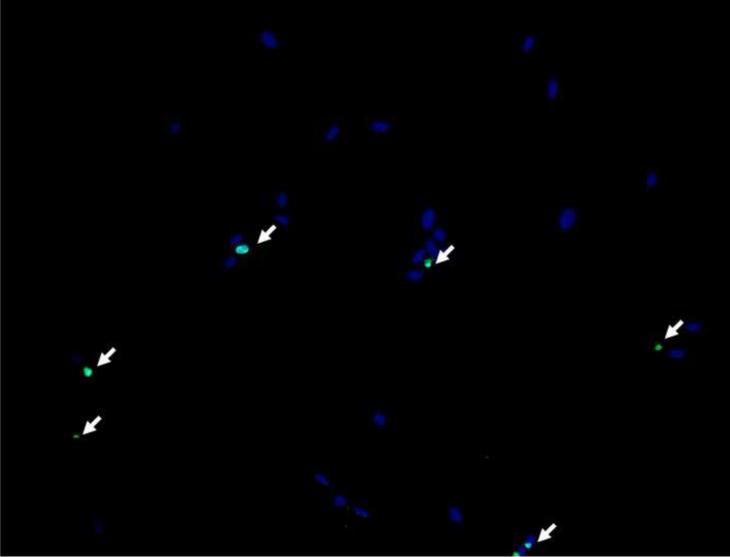
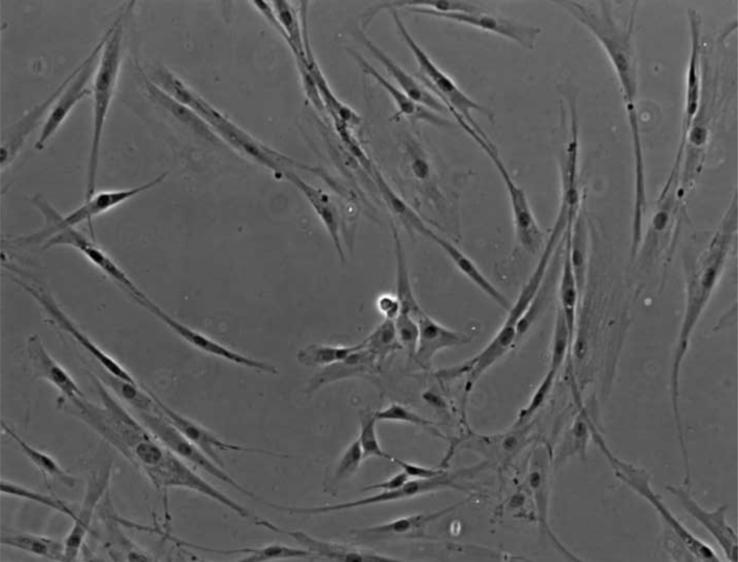
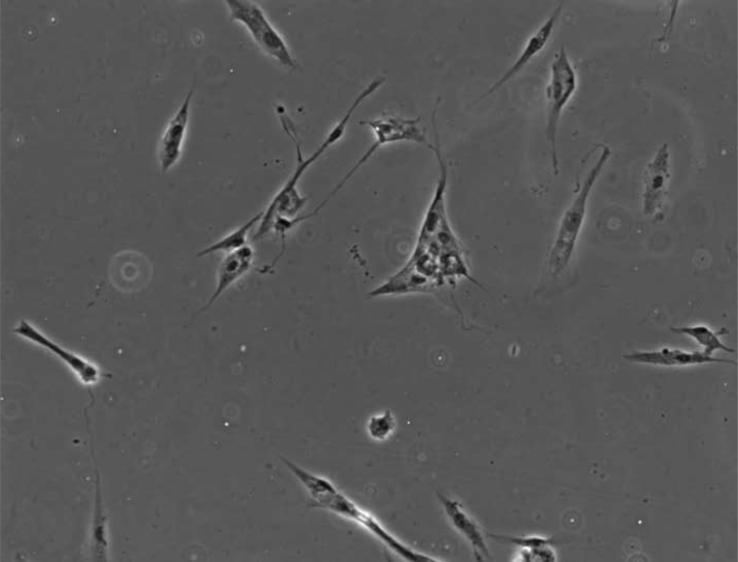
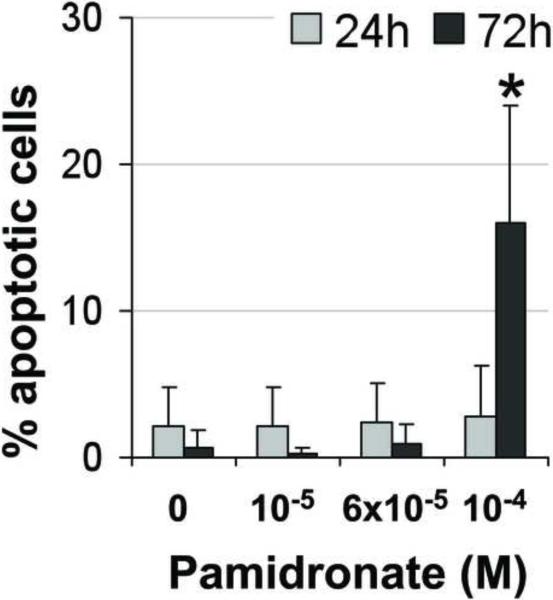
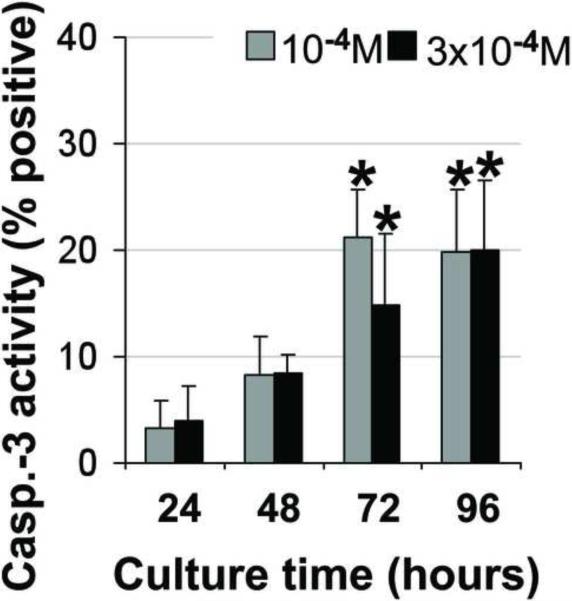
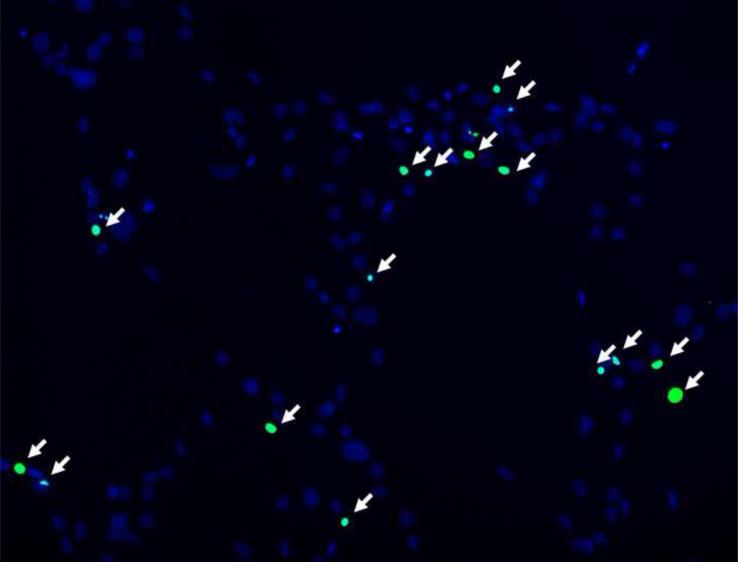
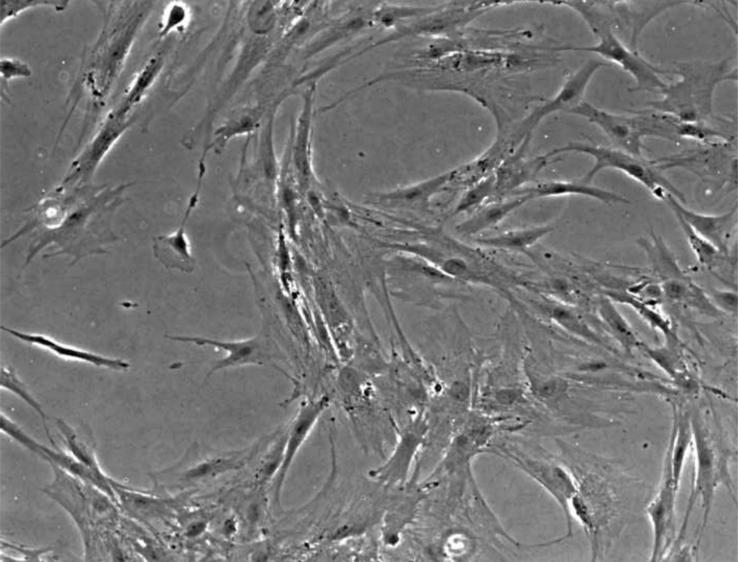
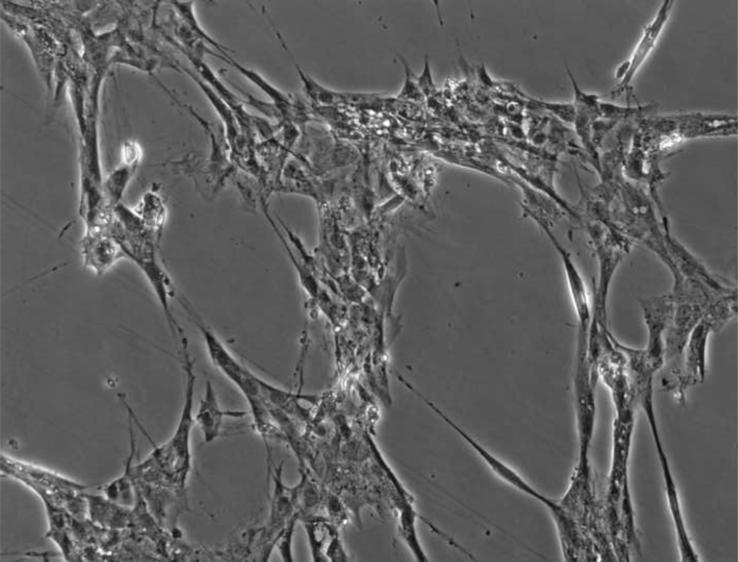
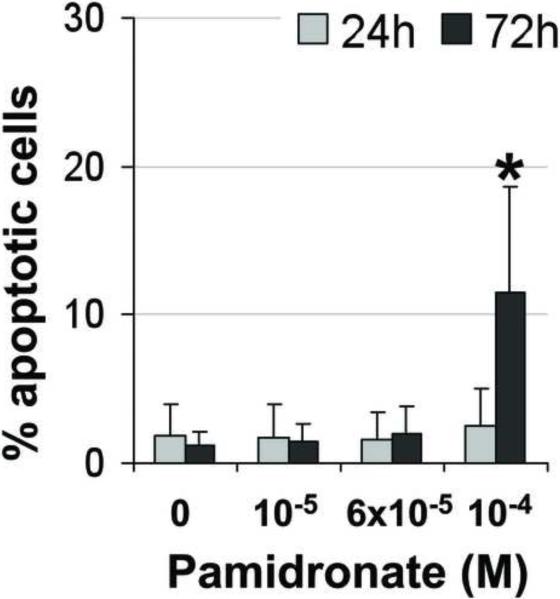
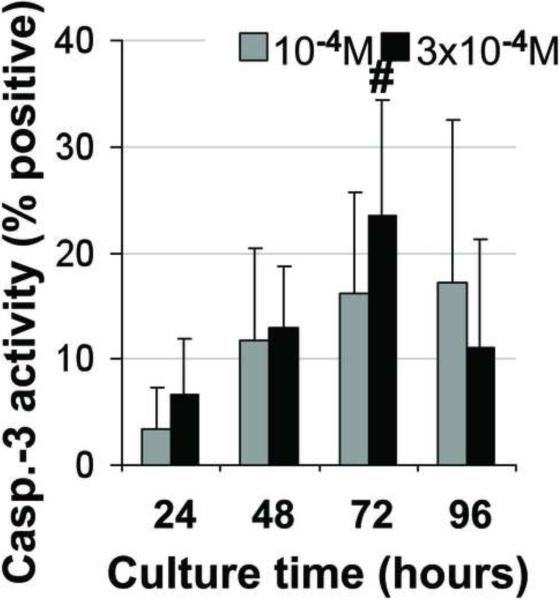
Figure 4. Induction of apoptosis in alveolar osteoblast (A, B, C, D, E, F) and BMSC (G, H, I, J, K, L) treated cultures.
Tunel assay (green stain) indicated the presence of apoptotic cells (white arrows) in the total cell population (blue stain - nuclei) treated with 10−4 M pamidronate (B, H) compared to untreated controls (A, G). Corresponding bright-field images are shown for pamidronate treated (D, J) and untreated cultures (C, I). Magnification 100×. Quantitative assessments of the Tunel slides (E, K) and measurements of caspase-3 activity (F, L) indicated a significant increase in the apoptotic cells after 72h of treatment with 10−4 M pamidronate compared to lower concentrations (*, p< 0.001). A similarly increasing trend with significant increases of caspase-3 activity after 72h was found with three-times higher pamidronate concentration (#, p<0.01) (*, p< 0.001). Data represent averages ± SD of measurements (n=3–4) obtained from three alveolar bone and three BMSCs samples.

