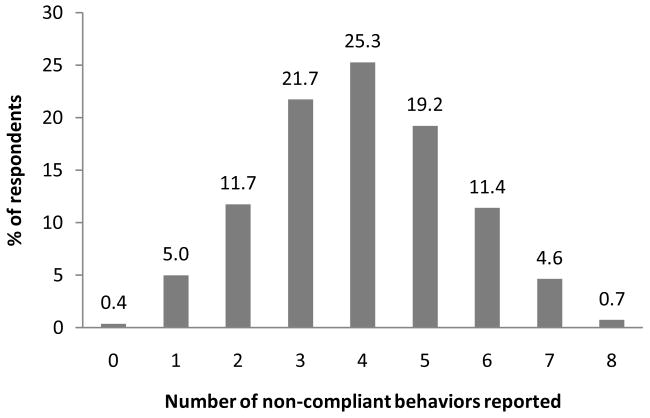
Figure 1.
Frequency distribution of the number of non-compliant behaviors reported in the DFW population. Only the eight behaviors used in the determination of actual compliance have been included. The average contact lens wearer is compliant with 50% of the behaviors assessed in this study. Only 1 patient was fully compliant with all eight behaviors (n=281).

