
Fig. 7.
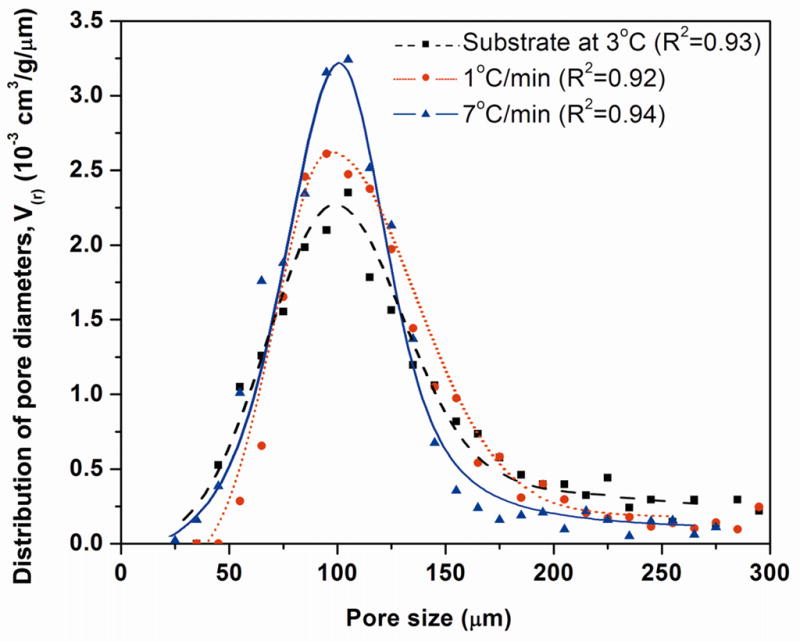
Distribution of the pore diameters for sintered constructs (1 h at 700 °C) prepared by freezing on a constant-temperature substrate (3 °C), or at constant freezing rates of 1 and 7°C /min. The data points for each sample were fitted by polynomial function, and the R2 value for each curve is shown.