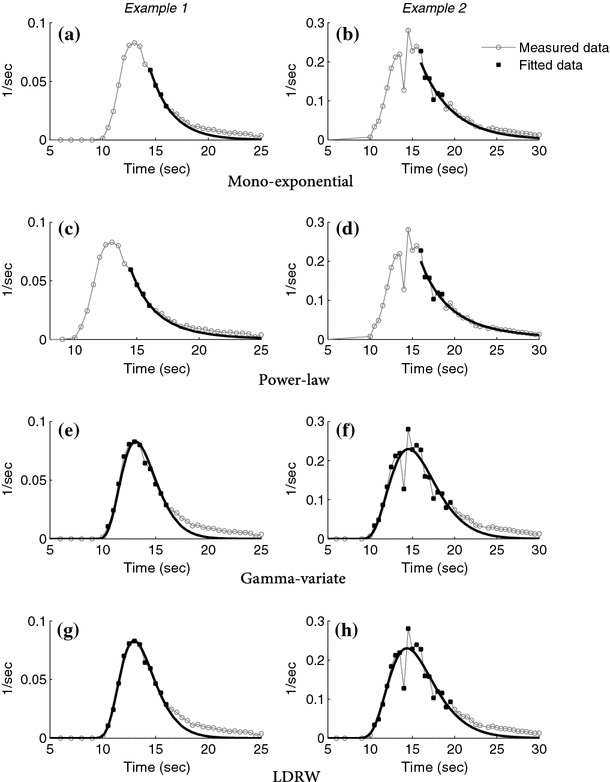
Fig. 2.

Two examples (left and right) of a transfer function fitted with the four different models a, b mono-exponential, c, d power-law, e, f gamma-variate, and g, h LDRW model. The measured data is indicated by the open circle and gray line, the black lines are fitted curves based on the data one point above 70 up to 30% of the height of the peak on the descending slope of the transfer function (a–d) and all data up to 30% of the peak height on the descending slope of the transfer function (e–h). The data used by the models are marked by closed squares. Data not yet corrected for the transit time of the sampling catheter (9.9 s)
