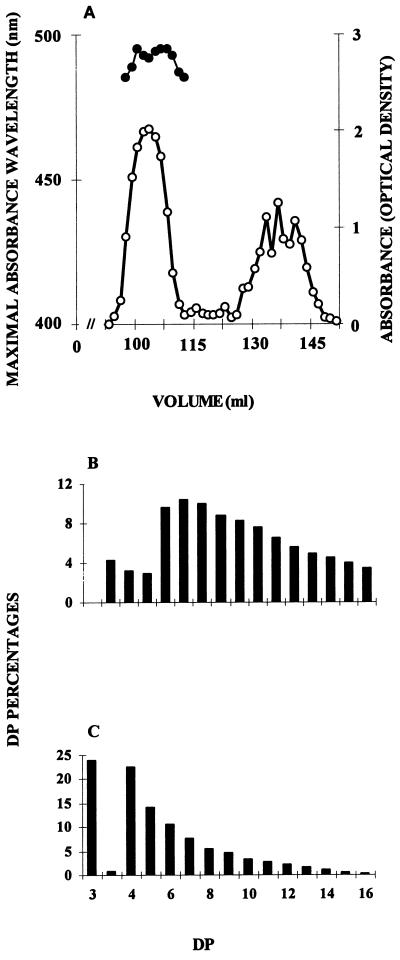
Figure 1.
Determination of the chain-length distributions of both sta7 high- and low-molecular-mass WSPs. A, TSK-HW-50 gel-permeation chromatography of sta7 WSP. The λmax (in nanometers [•]) of the undebranched fractions is scaled on the left y axis and the amount of Glc (in micrograms per milliliter [○]) measured for each fraction is indicated on the right y axis. The x axis shows the elution volume scale (in milliliters). B and C, Histograms of chain-length distributions obtained through gel electrophoresis of fluorescent glucans with or without isoamylase-mediated enzymatic debranching. Both chain-length distributions of debranched high-molecular-mass (B) and undebranched low-molecular-mass (C) WSPs eluted from the TSK-HW-50 column (A) are displayed as percentages of chains of DP between 2 and 16. The x axis displays a DP scale, and the y axis represents the relative frequencies of the chains expressed as percentages. The peak seen between DPs 3 and 4 is consistent with the position of a branched trisaccharide.

