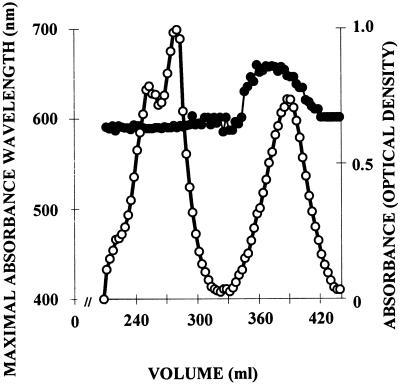
Figure 2.
Separation of amylopectin-like material and amylose extracted by TSK-HW-75 gel-permeation chromatography. Absorbance ([○]) was measured for each fraction at λmax (y axis on the right). The λmax (in nanometers) is displayed as an unbroken, thin line on the left y axis. The x axis represents the elution volume scale (in milliliters).

