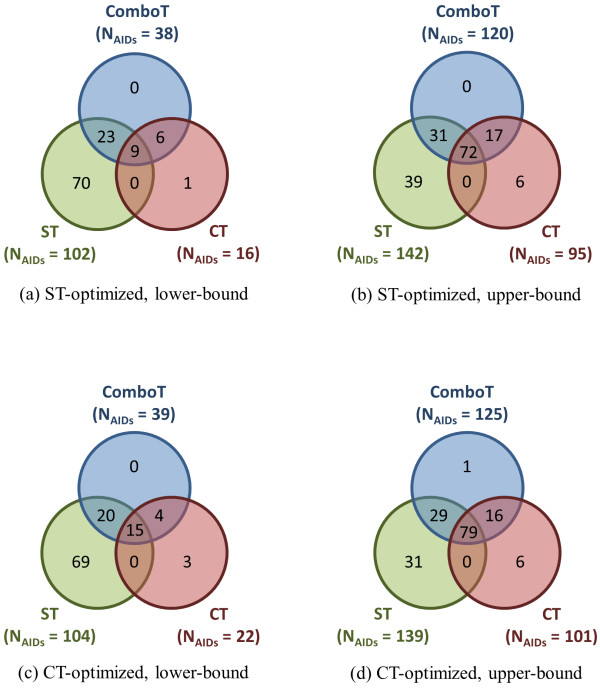
Figure 11.
Assay μ[μ(XTNN-NI)] outlier commonality by 3-D similarity type. The Venn diagrams show the number of AIDs whose difference of the average similarity scores for noninactive-noninactive (NN) pairs and noninactive-inactive (NI) pairs of 1,389 AIDs in the PubChem BioAssay database are out of the range of  , where "lower-bound" corresponds to μ - σ and "upper-bound" corresponds to μ + σ.

