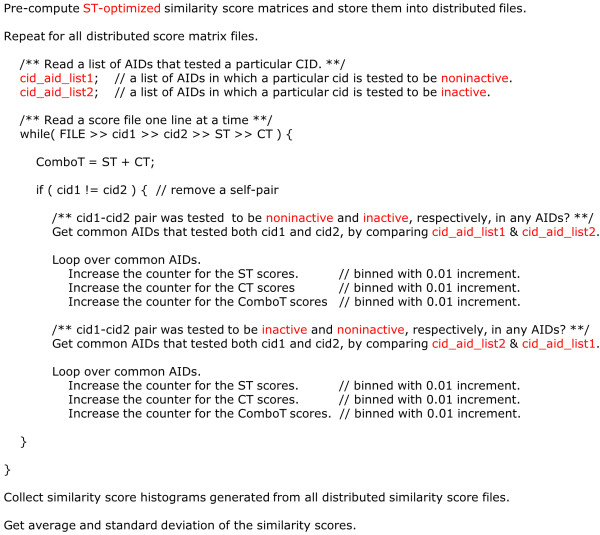
Figure 16.
Analysis method overview. Pseudo code that describes the process by which the average and standard deviation of the ST-optimized similarity scores for noninactive-inactive (NI) pairs for individual bioassay were computed. This process was repeated for the CT-optimized similarity scores. For the average and standard deviation of the similarity scores for the noninactive-noninactive (NN) pairs were also computed in a similar manner, except that only the cid_aid_list1 (for noninactves) was searched both for cid1 and cid2.

